View Raw Logs from Live or Disk
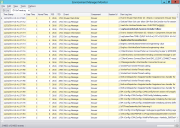
This view displays the raw log lines from either the live log or from a log file on disk.
You can sort, filter, group, search, and format the dataset to display the relevant information.
Log lines displayed in bold contain multiple lines that are not displayed in the view. To display the data, either hover over the row or select Options > Auto Row Height.
Enable Logging
To enable logging on the endpoint, select Options > Settings > Logging Enabled. A reboot or agent restart is not required. Logging can be enabled using the Environment Manager Logging Setup tool.
For further information, see Enable Logging. To view the live log in real time, see Load Live Logs.
Change Logging Settings
Further logging settings are available within the Environment Manager Monitor. Use these settings to define the name, location, detail level, components, and performance.
-
Select Options > Settings > Logging Settings.
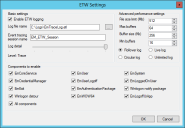
The ETW Settings dialog displays.
-
Set the required options for logging. The following settings are available:
Setting Description Enable ETW logging Enable or disable logging on the local endpoint. Log file name The location and name to which the log file is written. Event tracing session name The name for the event tracing session. This name is used in Performance Monitor. Log detail The level of detail that is logged. The following options are available: - Critical
- Error
- Warning
- Informational
- Trace
Unless advised otherwise by Support, it is recommended that the Log detail slider is set to Trace.
Components to enable The components that are logged. The following components are available: - EmCoreService
- EmUser
- EmSystem
- EmCredentialManager
- EmUserLogoff
- EmLoggedOnUser
- EmExit
- EmAuthenticationManager
- Winlogon notify package
- Winlogon detour
- EmWOW64
- EmLogoffUiApp
File size limit The maximum size of the log file in Mb if Circular Logging or Live Logging is enabled. Max buffers The maximum number of buffers. Buffer size The size of each buffer in Kb. Min buffers The minimum number of buffers. Log File Mode Set the log file mode. The following options are available: - Rollover log - The log file grows to the specified size limit. Once it has reached the limit, a new log file is created with a version number appended to the name.
- Live log - Logging can be viewed in real time using the Environment Manager Monitor. This is the equivalent of Real Time logging in Windows Event Tracing.
- Circular log - The log file grows to the specified size limit. Once it has reached the limit, the log file automatically overwrites the oldest entries.
- Unlimited log - The log files grows indefinitely regardless of the size limit.
-
Click OK.
The logging settings are applied. A reboot or agent restart is not required.
Loading Log Files
If logging is enabled in Live Log mode on the current endpoint, the live log file can be viewed in real time. To view the live log, select File > Live Logs.
To stop the view automatically scrolling as new log entries are received, deselect Options > Auto Scroll.
-
Select File > Open Log File.
A file browse dialog displays.
-
Select an ETL log file and click Open.
Environment Manager Monitor loads the log file. The loading progress displays at the bottom of the dialog. The log file may take a few minutes to load depending on its size, event types and event detail
-
Select File > Recent Log Files.
A list of recently used log files displays.
-
Select a log file to open.
Environment Manager Monitor loads the log file. The loading progress displays at the bottom of the dialog. The log file may take a few minutes to load depending on its size, event types and event detail.
Export Log Files
- Select File > Export.
- Select a format to export to. The following options are available:
- Excel
- CSV
- Text
- Rich Text
- Web Page
PDF
A file save dialog displays.
-
Select an export location and click Save.
The current dataset is exported to the selected location.
Manipulate the Data View
- Right-click a column heading
-
Select Column Chooser.
The Customization dialog displays.
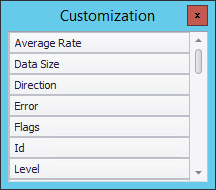
- Drag a column from the Customization dialog into the desired position on the header row.
- Right-click a column heading.
- Select a sort order:
- Sort Ascending - Sort the data in ascending order.
- Sort Descending - Sort the data in descending order.
- To clear the sorting, right-click the column heading and select Clear Sorting.
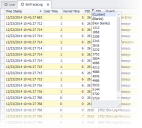
This option displays all of the unique values for a field, such as all Session IDs, from the open log file. Columns can be filtered by a specific value from the dataset.
The Auto Filter Row displays above the dataset and allows columns to be filtered by entering basic filtering criteria.
-
Select View > Filters > Auto Filter Row.
The Auto Filter Row displays below the column headings.
-
To filter a column, enter the text into the Auto Filter Row.
The data is filtered to show only entries that match the criteria entered in the Auto Filter Row.
- To clear the filtering, select View > Filters > Clear.
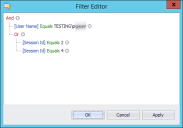
The Filter Editor allows conditions to be created to target specific data in the dataset. Complex conditions can be created by using multiple expressions and nested Boolean operators.
- Select View > Filters > Filter Editor.
-
Edit the condition as required:
- Click a red Boolean operator, such as And, to edit the operator or add a new condition group.
- Click a blue field name, such as [Time Stamp], to change the field to match.
- Click a green operator, such as Equals, to edit the operator.
- Click either <enter a value> or a black value to enter a value.
-
Click
 to add a new expression to the condition.
- Click Apply to preview the filter.
-
Click OK.
The data is filtered to show only entries that match the criteria entered in the Filter Editor.
- To clear the filtering, select View > Filters > Clear.
-
Select View > Groups > Group By Box.
The Group By box displays above the column headings.
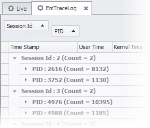
- Drag a column heading into the Group By box. More columns can be dragged into the Group By box to create nested groupings.
The data is grouped by the fields specified in the Group By box.
- To clear the grouping, right-click the Group By box and select Clear Grouping.
-
Select Edit > Find Panel.The Find Panel displays above the column headings.
Enter a search term.
- Click Find.Rows containing text in any column that matches the entered search term are displayed.
- To clear the search, click Clear in the Find Panel or close the Find Panel.
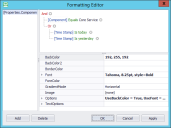
Conditional formatting allows rows or text to be formatted based upon the data within one or more fields.
-
Select Tools > View > Formatting Editor.
The Formatting Editor dialog displays.
- Click Add to add a new condition. Edit the condition as required:
- Click a red Boolean operator, such as And, to edit the operator or add a new condition group.
- Click a blue field name, such as [Time Stamp], to change the field to match.
- Click a green operator, such as Equals, to edit the operator.
- Click either <enter a value> or a black value to enter a value.
- Click
 to add a new expression to the condition.
-
Once the condition has been constructed, set the formatting properties for rows that match the condition. Available options include row background color, row border color and text formatting.
- Click Apply to preview the conditional formatting.
- Click OK.
- Rows matching the criteria specified in the Formatting Editor are formatted.
- To clear the formatting, select View > Formatting > Clear.
The footer allows statistics to be displayed for one or more fields. The sum, minimum, maximum, count, and average values are available for each field.
One or more log lines can be copied to a new tab to allow the data to be analyzed independently. Tabs can be renamed to make it easier to work with multiple tabs.
- Select one or more log lines from the log file. Multiple lines can be selected by using the Ctrl or Shift keys.
- Select Edit > Copy To New Tab
- A new tab is created containing the selected log lines.
- To rename the created tab, right-click the tab and select Rename.
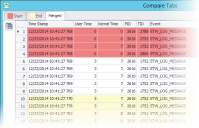
Data from two tabs can be merged and compared in a single view. The rows are color-coded to differentiate between the two sources.
- Select the first tab to compare.
-
Select Tools > Compare With.
A list of open tabs displays.
-
Select a tab to compare with the current tab.
The Compare Tabs dialog displays.
Log lines that are present in both tabs display in white, those from only the first tab display in red and those from only the second tab display in yellow.
-
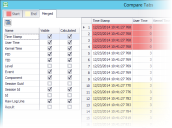
Click
 to access merge and compare options.
 - Change the options as required and click Refresh. The following options are available:
- Visible - Change the columns that are displayed in the comparison.
Calculated - Change the columns that are used for the comparison.
The merged data is displayed with the specified columns visible.
View Session Information
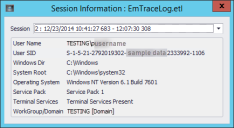
The Session Information dialog provides information about each user session from the loaded log file.
The drop-down lists the session number and the logon and logoff times. When a session is selected, detailed information about the session displays.

 .
.